The question on the board is simple: what is your favorite ice cream? Hands go up, you tally the votes, and then comes the part that matters — turning that tally into a graph the whole class can read. A child who can read a bar graph can read a weather chart, a sports table, and a science result. A child who can make one can answer a question with evidence instead of a guess.
The tools below cover the whole path from first graph to real data. There are pictograph games for first graders, a free graph maker that prints a class graph in minutes, free lessons that explain each graph type, and two free platforms where fifth and sixth graders explore real datasets. Most of them cost nothing.
How we picked: we checked each tool's official website on November 3, 2026 and only describe features and plans we could see there. We weighted fit for PreK–6 classrooms, whether a teacher can start for free, and whether children work with real data instead of only watching a graph appear.
Key takeaways
- Best free starting point: NCES Create a Graph — type in class data and print a graph in minutes.
- ABCya covers the youngest graphers with a pictograph game for grades 1–2, and Google Sheets turns a class survey into a real chart.
- Khan Academy teaches the graph types themselves, with free lessons and practice.
- NRICH and Tuva move children from making graphs to asking questions of real data.
- CODAP and GeoGebra suit grades 4–6 best; both are free, with no paid plan needed for classroom use.
Quick comparison
| # | Tool | Best for | Grades / audience | Pricing | Free plan |
|---|---|---|---|---|---|
| 1 | a first class graph | Elementary | Free | Yes | |
| 2 | first graphing games, grades 1–2 | Pre-K–grade 6 | Freemium | Yes | |
| 3 | real charts from class data | Grades 3–6 | Free | Yes | |
| 4 | data investigations, not drills | Ages 5–11 (UK primary) | Free | Yes | |
| 5 | teaching bar and picture graphs | Grades 2–6 | Free | Yes | |
| 6 | real data, grades 2–5 | Grades 2–5 | Free + paid | Yes | |
| 7 | older students exploring real data | Grades 5 and up | Free | Yes | |
| 8 | graphing and data with older students | Grades 4–12 | Free | Yes |
Make a tool for teachers?
Built something teachers love? We keep these guides fresh, so send us a new tool, updated pricing or a featured spot request.
Request a listingThe 8 best picks
- Pricing
- Free
- Free plan
- Yes
- Grades / audience
- Elementary
Create a Graph, from the National Center for Education Statistics' Kids' Zone, is a free tool where students type in their own data, pick a graph type, and print or download the result. There is no account to create and nothing to pay: a class can tally lunch votes, enter the numbers, add a title and labels, and walk away with a printed graph. Students can also email themselves a link to a saved graph, so they can come back and edit it later.
What we like
- Choose a graph type and enter your own data values
- Add a title, source, labels, colors, and fonts
- Print or download the finished graph
- Email yourself a link to save and edit the graph later
Watch out for
- Pop-ups must be enabled in the browser to print or download.
- The design is plain and dated, so older students may find it less engaging.
Pricing: Free — no account or payment is needed to make and print a graph.
- Pricing
- Freemium
- Free plan
- Yes
- Grades / audience
- Pre-K–grade 6
ABCya is a library of learning games for Pre-K through grade 6, with a free game of the week and a membership that unlocks 300+ games. Its Fuzz Bugs Graphing game, for grades 1–2, has children sort Fuzz Bugs by color, read the graph they made, and answer questions about it — then color their own Fuzz Bug as a reward. Games are sorted by grade, so a teacher can find a grade 1–2 graphing game in seconds.
What we like
- Fuzz Bugs Graphing for grades 1–2: sort, graph, and answer questions
- Games sorted by grade from Pre-K to grade 6
- Free games each week; membership unlocks 300+ games
- Printables alongside the games
Watch out for
- The site carries ads on the free version.
- ABCya is part of IXL Learning, so some pages point toward other IXL products.
Pricing: Free games each week; a membership unlocks 300+ games.
- Pricing
- Free
- Free plan
- Yes
- Grades / audience
- Grades 3–6
Google Sheets is Google's free spreadsheet app, and its chart tool turns a table of class data into a graph in a few clicks. Students type in survey results, select the cells, choose Insert and then Chart, and Sheets suggests a chart type — bar, pie, line, or histogram — that they can then retitle, relabel, and recolor. Charts update when the data changes, so a growing class tally stays live.
What we like
- Insert a chart from selected cells in a few clicks
- Sheets suggests a chart type — bar, pie, line, histogram, and more
- Edit titles, axes, labels, and colors in the chart editor
- Charts update when the data changes
Watch out for
- Students need a Google account to save their work.
- The full chart editor has many options, so keep first lessons to one chart type.
Pricing: Free with a Google account.
- Pricing
- Free
- Free plan
- Yes
- Grades / audience
- Ages 5–11 (UK primary)
NRICH, from the University of Cambridge, publishes free math problems and investigations for primary students, including a Meaningful Data Handling feature. Its activities ask children to pose their own questions, collect data, and present it — with tasks like a ladybird count graph, Venn and Carroll diagram interactivities, real travel-to-school statistics, and a dog-walking graph story. Problems carry stars that mark the challenge level, so a teacher can match the task to the class.
What we like
- Meaningful Data Handling feature with a four-step model: pose, plan, collect, present
- Interactivities for Venn diagrams, Carroll diagrams, and graph stories
- Problems marked with stars that show the challenge level, so a teacher can match the task to the class
- Free, with teacher notes and solutions published for live problems
Watch out for
- Activities are problems to think through, not auto-marked games, so the teacher leads the discussion.
- Some pages are text-heavy for the youngest readers.
Pricing: Free — all NRICH problems and features are free on the site.
- Pricing
- Free
- Free plan
- Yes
- Grades / audience
- Grades 2–6
Khan Academy is a free nonprofit learning platform with a full data strand for elementary students. Its 'Get ready for data' unit for grade 3 builds bar graphs, picture graphs, and line plots, and its articles walk children through creating bar graphs from data and tables, and picture graphs where each symbol stands for more than one item. Teachers can assign the practice and watch progress in reports, all free.
What we like
- Grade 3 'Get ready for data' unit: bar graphs, picture graphs, and line plots
- Step-by-step articles on creating bar graphs from data and tables
- Picture-graph practice where one symbol can stand for 2, 3, or more items
- Free teacher tools to assign practice and see student progress
Watch out for
- The data units sit inside grade-level math courses, so link straight to the data unit rather than the homepage.
- Students need an account to save progress.
Pricing: Free — courses, videos, articles, and practice are free for teachers and students.
- Pricing
- Free + paid
- Free plan
- Yes
- Grades / audience
- Grades 2–5
Tuva builds data literacy tools for K–12 math and science. Its new Tuva Jr. program is made for grades 2–5: playful, scaffolded activities where children dig into real datasets and practise math in real-world contexts. Older students use Tuva Math and Tuva Science for grades 6–12, with real-world datasets and inquiry tasks. Teachers create classes, assign activities, and grade the work inside Tuva.
What we like
- Tuva Jr. for grades 2–5: playful data activities with careful scaffolding
- Real-world datasets students explore and graph themselves
- Tuva Math and Tuva Science for grades 6–12
- Teacher tools to create classes, assign activities, and grade work
Watch out for
- Pricing is per teacher or per school per year, so check with your school before buying.
- Tuva Jr. is new, so its activity library is smaller than the 6–12 collection.
Pricing: Tuva Basic is free; Tuva Jr. costs $250 per teacher per year ($2,000 per school), and Tuva Premium is $400 per teacher per year.
- Pricing
- Free
- Free plan
- Yes
- Grades / audience
- Grades 5 and up
CODAP, the Common Online Data Analysis Platform from the Concord Consortium, is a free web app for learning data science. Students drag variables from a table to make a graph, and selecting one representation highlights the same data in every other view. They can drop in a CSV file, paste from a spreadsheet, or pull data from census, weather, and sensor sources, and the site offers example datasets from mammals to earthquakes.
What we like
- Drag-and-drop graphs, maps, and tables from the same dataset
- Dynamic linking: select data in one view and see it highlighted everywhere
- Import by dragging in a CSV, pasting from a spreadsheet, or using a URL
- Example datasets and plugins, from mammal species to earthquake records
Watch out for
- The interface has more buttons than a simple graph maker, so budget one lesson to learn it.
- Some example datasets and curricula are aimed at high school.
Pricing: Free — CODAP is a free web app with no paid plan.
- Pricing
- Free
- Free plan
- Yes
- Grades / audience
- Grades 4–12
GeoGebra is a free interactive math platform with calculators, ready-made resources, and a Classroom tool. Its curated resources cover grades 4–12, and the Calculator Suite graphs functions, explores data and statistics, and builds dynamic constructions. Many features work without an account, and downloaded apps work offline.
What we like
- Free Calculator Suite for graphing, data, and statistics
- Curated math resources for grades 4–12
- Classroom platform where teachers watch progress live and give feedback
- No account needed for many features; apps work offline once downloaded
Watch out for
- The youngest elementary students will find it too advanced; it fits grades 4 and up.
- Saving work online or sharing needs an account.
Pricing: Free for non-commercial use, including most school use; commercial use needs a separate license.
How we chose
We started from tools PreK–6 teachers actually use and checked every one against its official website, pricing page and feature pages on November 3, 2026. We kept tools that fit elementary classrooms, noted whether a free plan exists, and wrote down honest limitations next to the strengths. Nobody paid to be included, and we don't use affiliate links on this page.
- Fit for PreK–6 classrooms, special education or homeschool
- Clear information on the official site about what the tool does and who it is for
- Free plan or free-for-teachers option noted where one exists
- Still active and maintained, with rebrands noted
How to choose the right tool
Start with the question, not the tool. A graph answers a question — favorite lunch, rainy days this month, books read. Pick the question first, collect the data together, then choose the tool that fits the graph type.
Match the graph to the age. Pictographs and bar graphs fit grades 1–3; line plots and line graphs fit grades 3–4; scatter plots and real datasets fit grades 5–6. A tool built for older students will frustrate a second grader.
Use real class data at least once. A graph of the class's own survey means more than any ready-made example. NCES Create a Graph and CODAP both take data your students collected themselves.
Teach the graph type before opening the tool. A child who knows what a bar graph shows will use any maker well; a child who does not will click at random. Khan Academy explains the types first — its articles walk children through making each graph before they practise.
Pair the screen with paper. After a digital graph, have students draw the same data on paper or build it with cubes. The printables below are built for exactly that.
Best pick by situation
- You want a 5-minute first graph with no accounts: NCES Kids' Zone — Create a Graph — type in data, print, done
- You want a free graphing game for grades 1–2: ABCya — Fuzz Bugs Graphing sorts and graphs
- You want a real chart from your class survey: Google Sheets — type the results, Insert Chart, done
- You want children to investigate their own data question: NRICH — Meaningful Data Handling investigations
- You want assigned practice with progress reports: Khan Academy — free data units with teacher reports
- You want real datasets for grades 2–5: Tuva — Tuva Jr. data activities with scaffolding
- Your 5th graders are ready for real datasets: CODAP — drag-and-drop graphs from real data
Pair it with printables
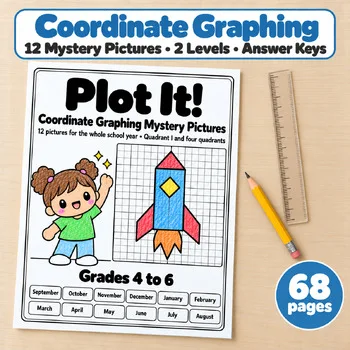
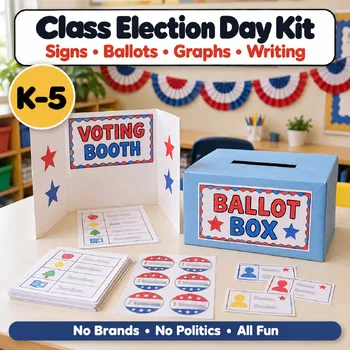
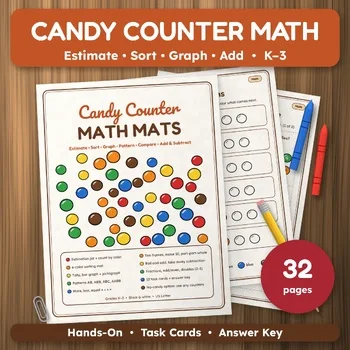
These Activity Express printables put the same graphing skills on paper — plotting ordered pairs, graphing class votes, and sorting and graphing real objects.
Frequently asked questions
What is the best free graphing tool for elementary school?
NCES Create a Graph is the quickest free start: type in your data, pick a graph type, and print it. For games, Toy Theater and ABCya are free too.
What is the difference between a pictograph and a bar graph?
A pictograph uses pictures or symbols to stand for data, while a bar graph uses bars of different heights. ABCya's Fuzz Bugs Graphing game teaches pictographs; for bar graphs, NCES Create a Graph or Google Sheets will build one from your data.
Can my students make graphs from our own class data?
Yes. NCES Create a Graph, CODAP, and GeoGebra all take data your students collect — a lunch survey, a weather log, or a class vote — and turn it into a graph.
Which tool is best for 5th and 6th grade?
CODAP and GeoGebra. CODAP is built for grades 5 and up with real datasets, and GeoGebra's resources start at grade 4. Both are free for school use.
Do any of these tools cost money?
Most are free. Tuva Basic is free, with Tuva Jr. at $250 per teacher per year and Premium at $400. ABCya has a paid membership that unlocks 300+ games, but some games are free each week.
Make a tool for teachers?
Built something teachers love? We keep these guides fresh, so send us a new tool, updated pricing or a featured spot request.
Request a listingDisclosure: no tool on this page paid to be included and we don't earn commissions from these links. Featured placements, if we ever offer them, will be clearly labeled "Sponsored". Details were checked on each provider's official website on November 3, 2026 and can change.